

Hyatt Prive Dashboard
OVERVIEW
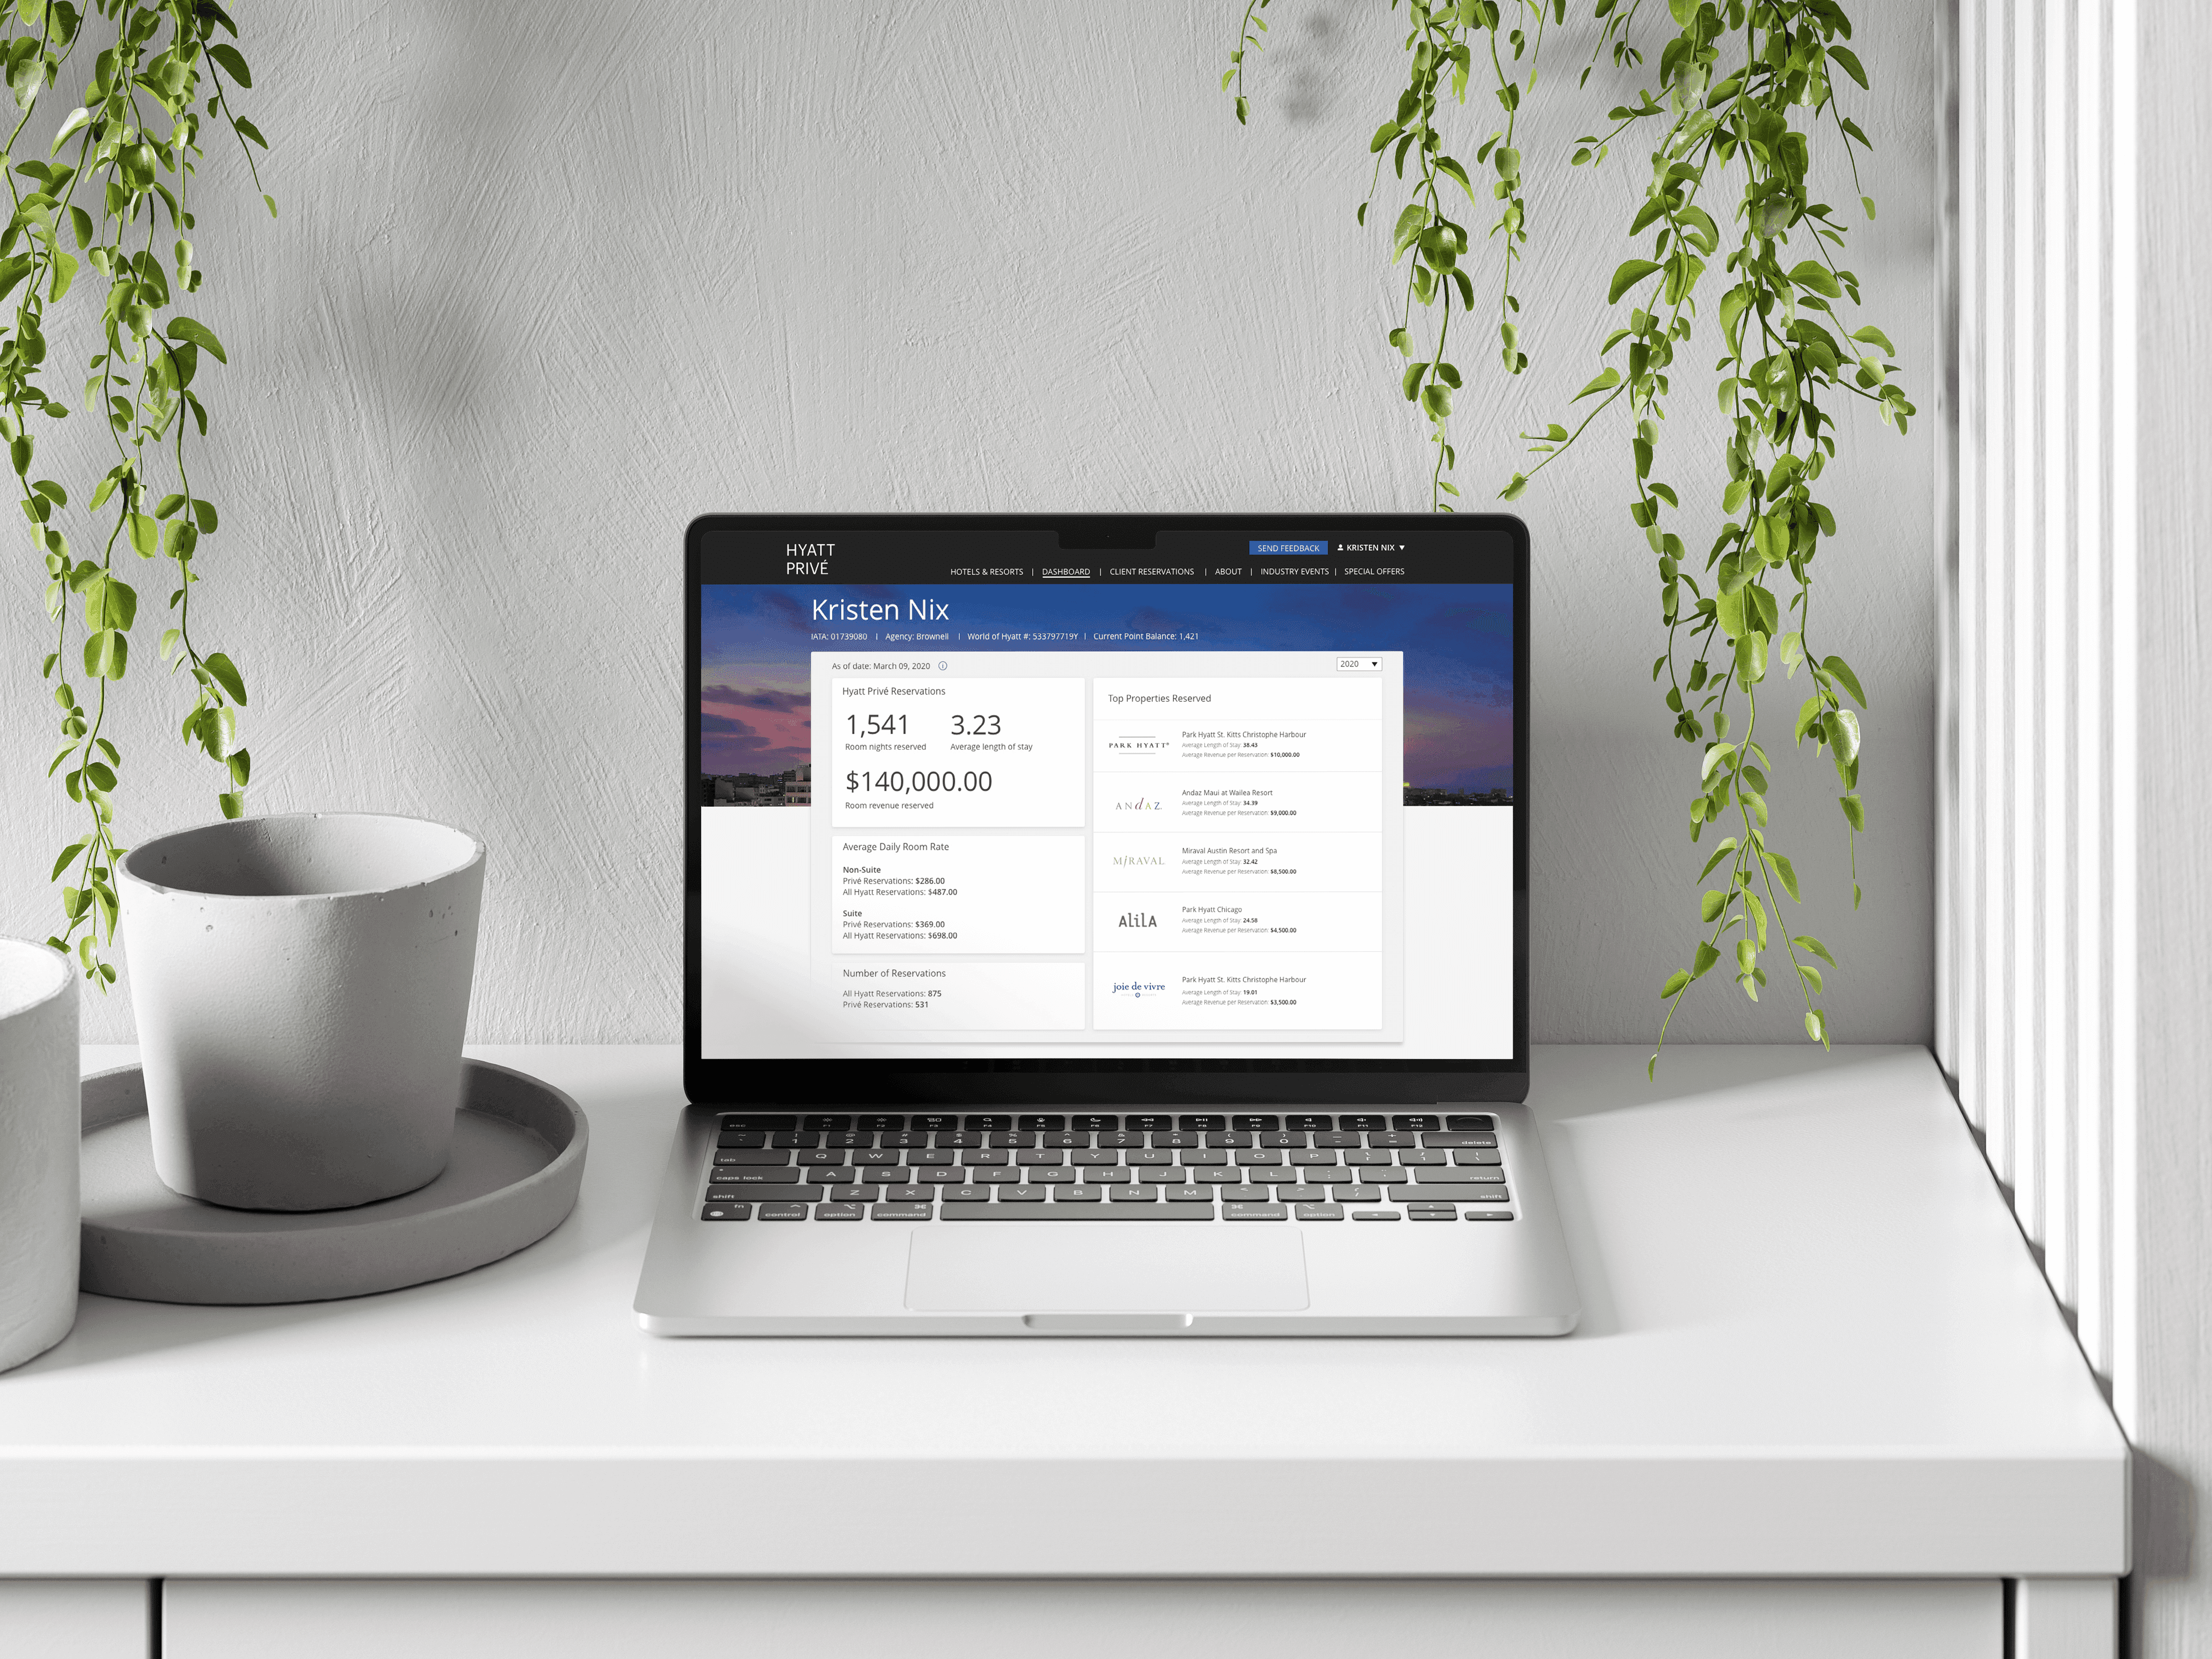
As the Hyatt Privé program continued to grow, the luxury travel advisors and agencies were asking for a quick and convenient way to understand their production in the program, their key performance metrics, and how they are tracking to their agent goals established by the LLL Global Director.
Ascent Order Entry
ROLE
Lead Product Designer
User Research, Architecture, Visual Design, Prototyping & Testing
September 2017 - May 2020
The Problem
The Problem
The Problem
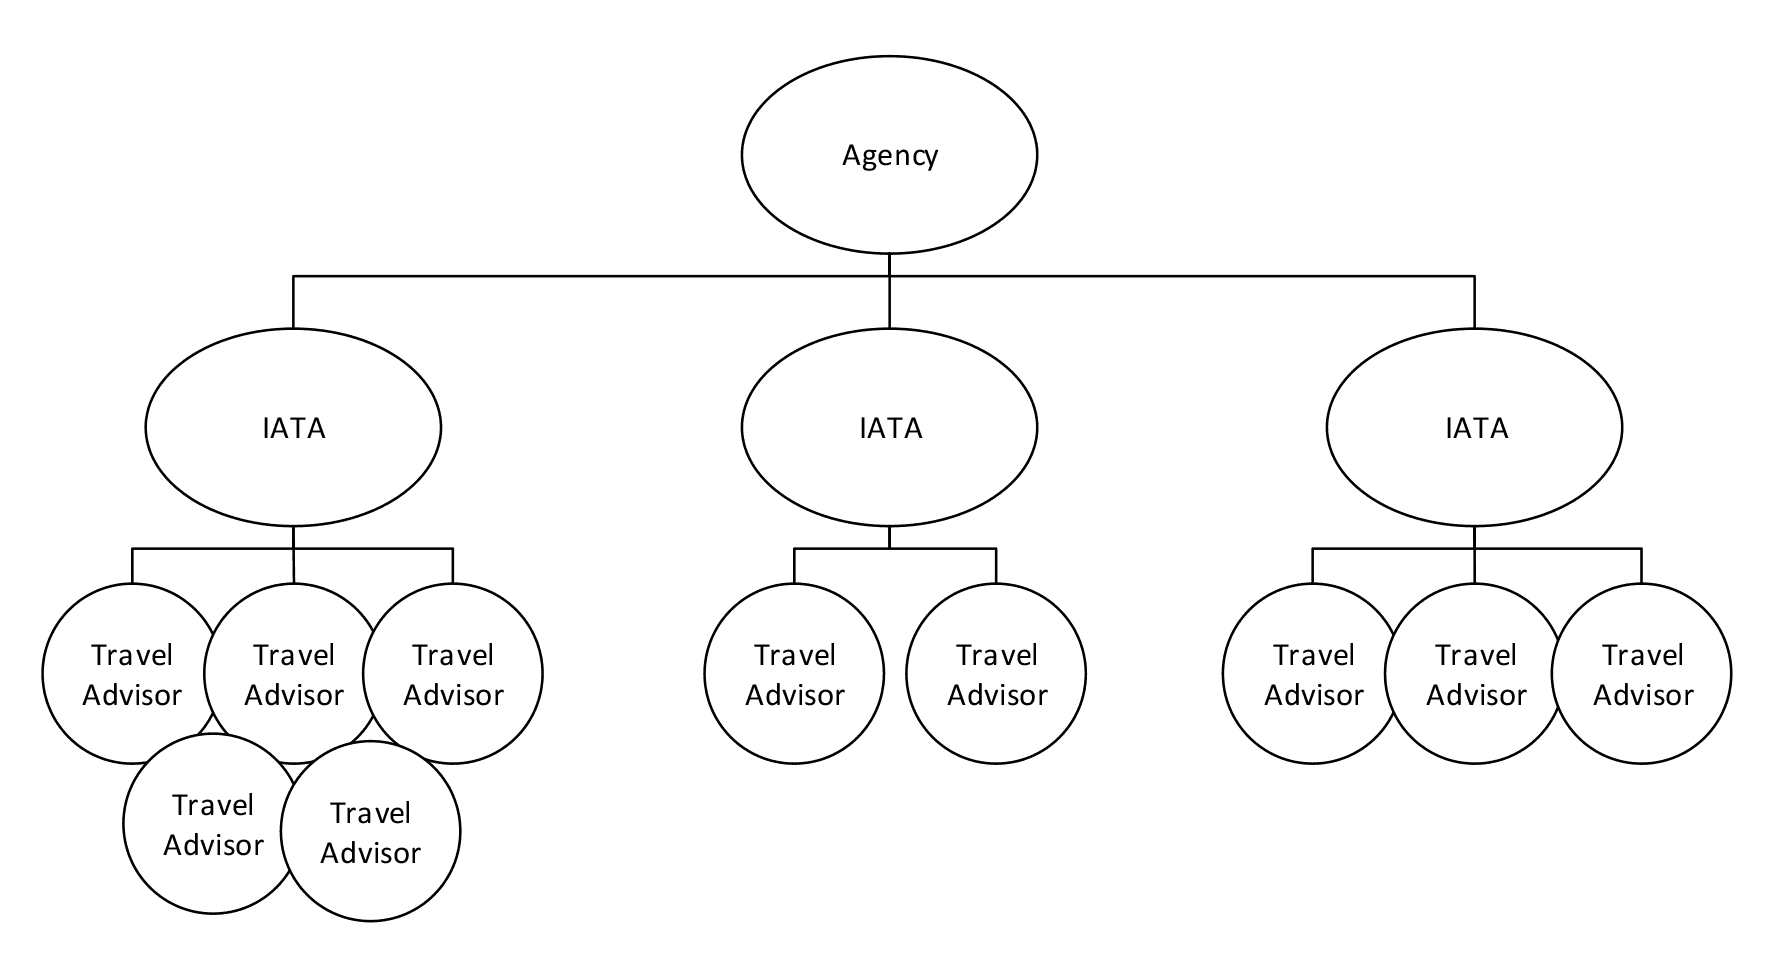
There was no way for Hyatt's travel advisors and agencies to track their metrics amongst their clients. There was a need for a dashboard experience on the Hyatt Privé website to provide luxury travel advisors and agencies a convenient place to view their Privé production, key metrics, goals, and ranking with Hyatt Privé program. There would be three views, a travel advisor view, IATA view, and an agency level view.
There was no way for Hyatt's travel advisors and agencies to track their metrics amongst their clients. There was a need for a dashboard experience on the Hyatt Privé website to provide luxury travel advisors and agencies a convenient place to view their Privé production, key metrics, goals, and ranking with Hyatt Privé program. There would be three views, a travel advisor view, IATA view, and an agency level view.
There was no way for Hyatt's travel advisors and agencies to track their metrics amongst their clients. There was a need for a dashboard experience on the Hyatt Privé website to provide luxury travel advisors and agencies a convenient place to view their Privé production, key metrics, goals, and ranking with Hyatt Privé program. There would be three views, a travel advisor view, IATA view, and an agency level view.
Dashboard Hierarchy
Dashboard Hierarchy
Dashboard Hierarchy


User Personas
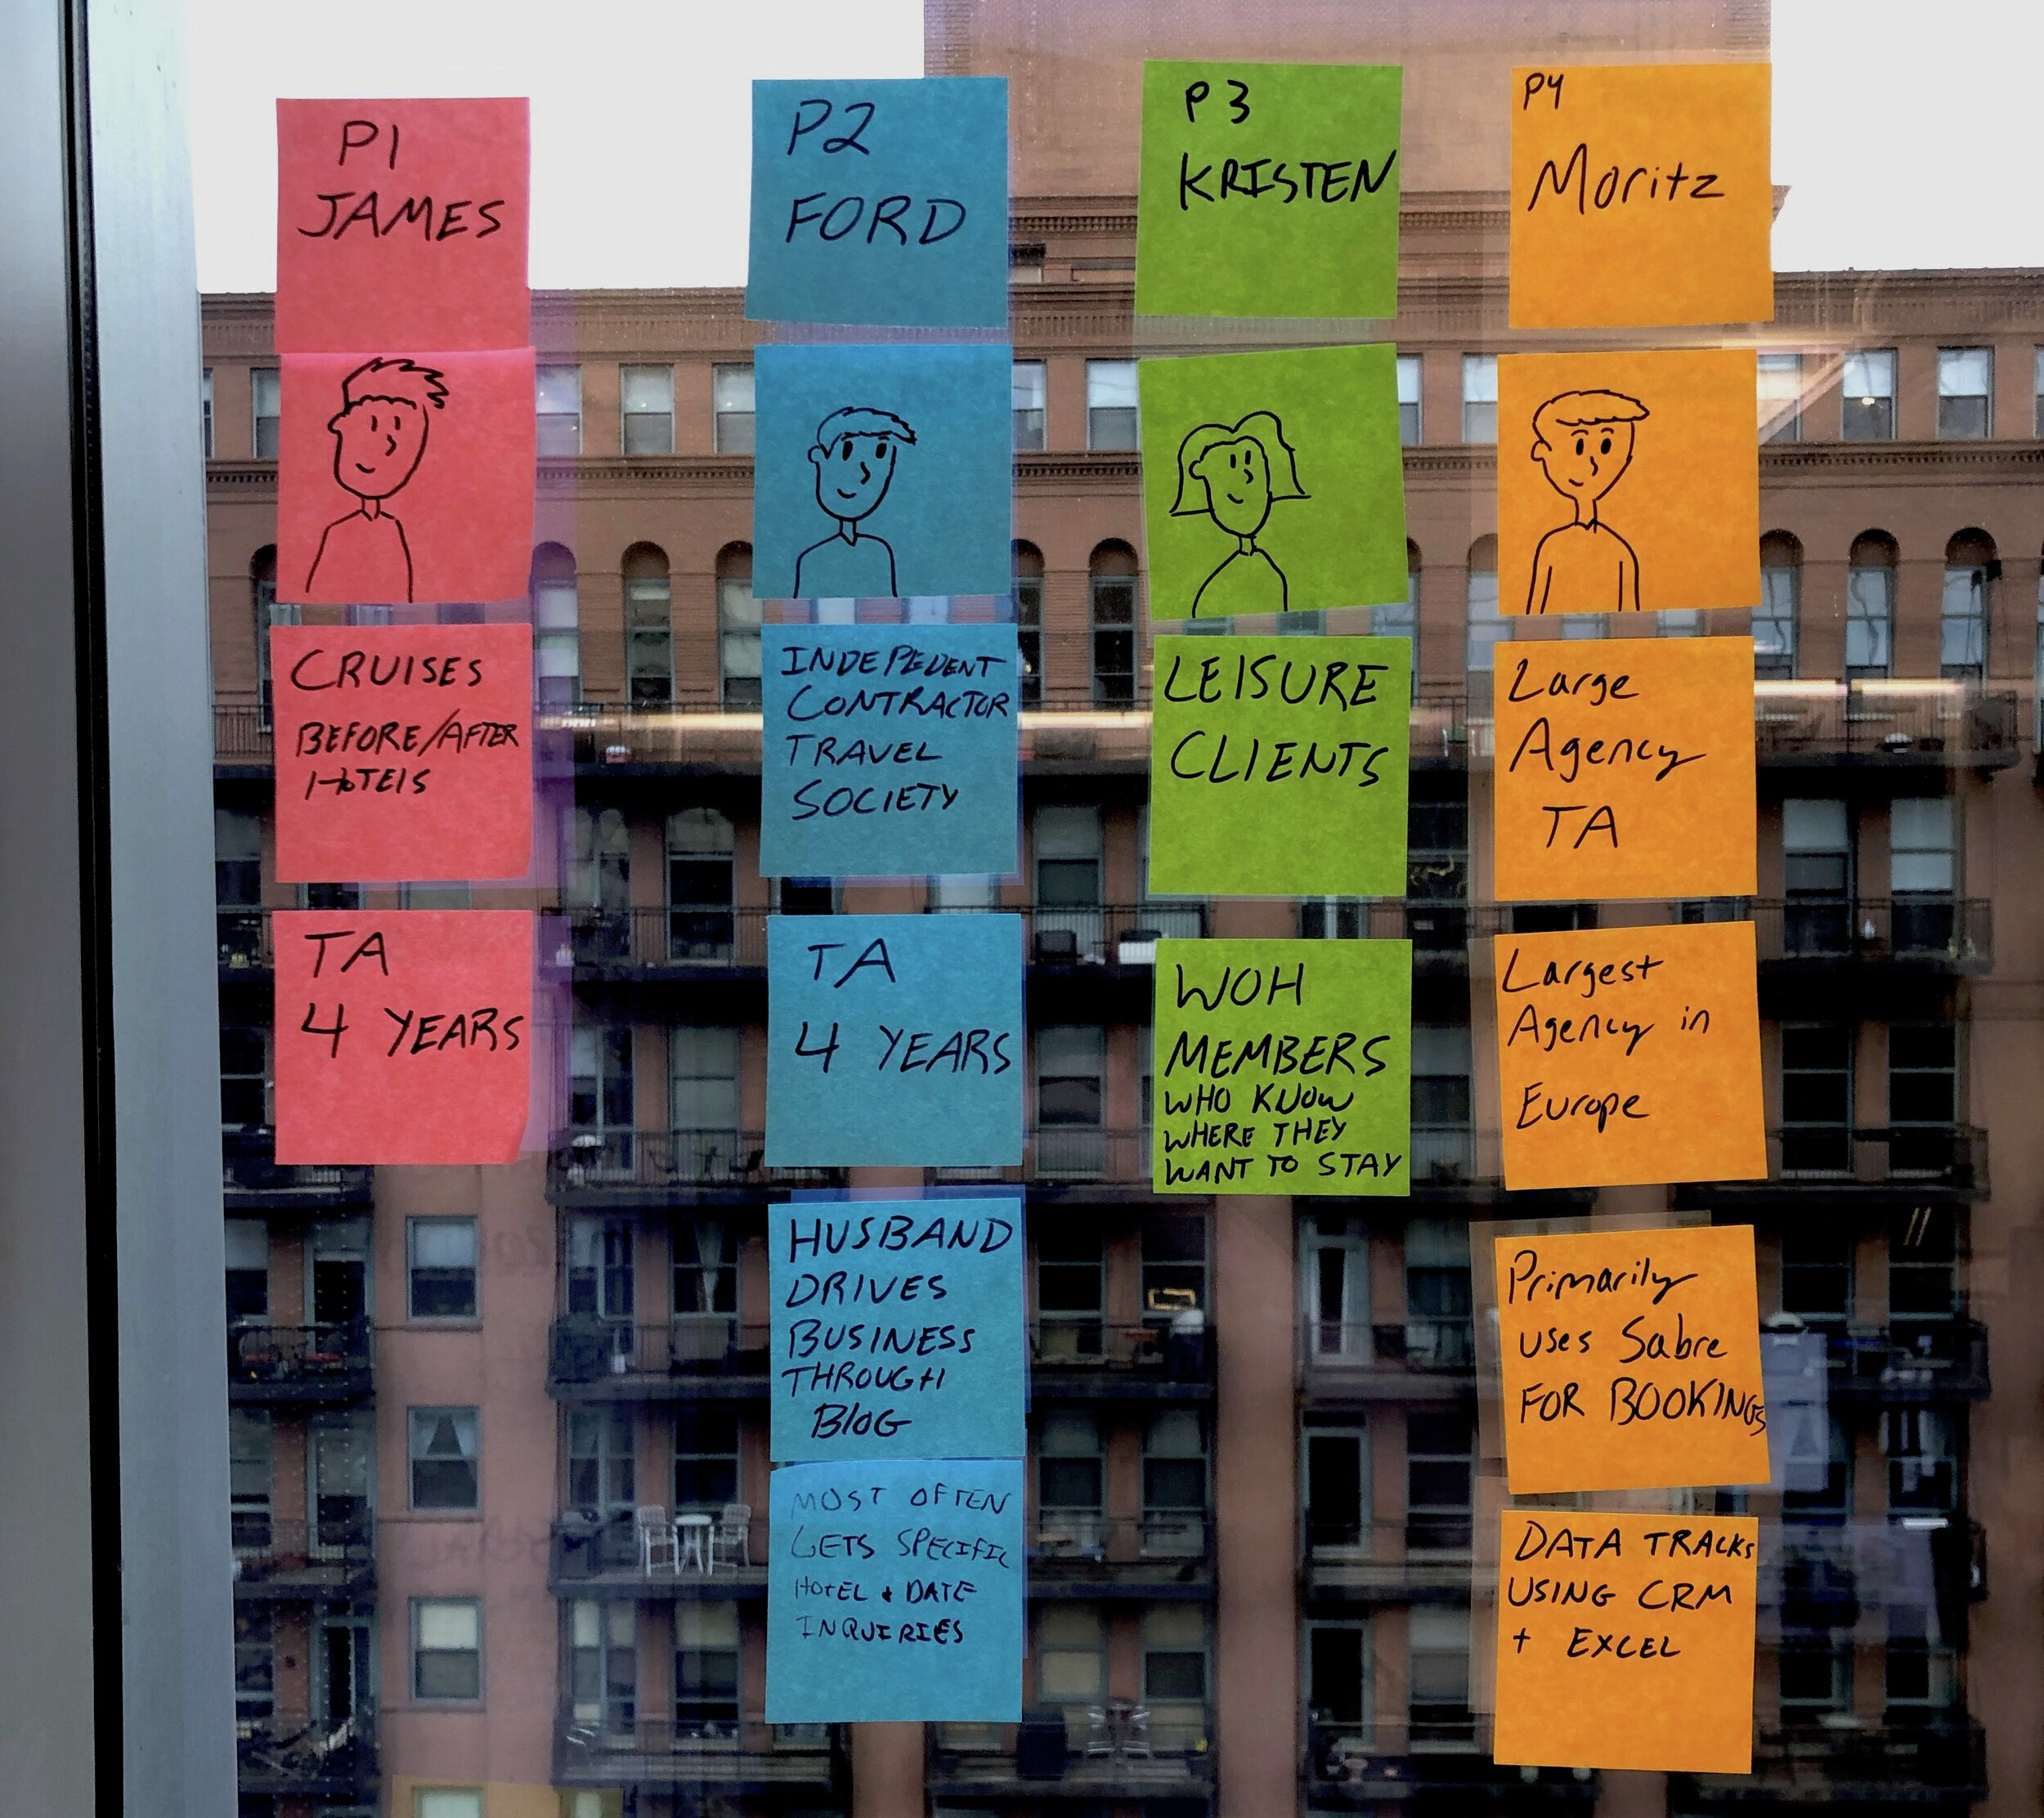
I talked to four travel advisors. Ford and Kristen are from the U.S., James is from the UK and Moritz is from Germany. I conducted 60 minute sessions with each of the participants learning about their day-to-day experience with Privé, as well as gaining feedback for the dashboard and brand education page.


Affinity Mapping
I began to synthesize the feedback to identify common themes and comments captured from our participants. Each note was color-coded to the specific participant and clustered within each similar piece of feedback.
Analyzing the Research
Analyzing the Research
Analyzing the Research
View Top Five Hotels
View Top Five Hotels
View Top Five Hotels
According to the travel agent feedback, they desired more detailed data points on the top 5 hotels panel. They stressed the importance of the top 5 hotels panel because it would help them build better relationships with the specific hotel properties, as well as familiarize themselves with the brand regions. They wanted to see the following data points for the top 5 hotel panel:
Average nights per guest and average dollars per hotel (shows the data that represents the top 5 hotels)
Highest selling hotel (creates stronger relationship with the specific hotel property)
Region of the brands (helps travel agents familiarize themselves with regions around the
brands)
Client info for top properties (helps match client’s preferences to the right
property)
Tracking Travel Agent Goal and Leaderboard
Tracking Travel Agent Goal and Leaderboard
Tracking Travel Agent Goal and Leaderboard
The TA’s were unfamiliar with the need of these data points, as well as not seeing a use for either of them. They mentioned that they did not see the importance of the goal tracker or leaderboard since there was no visible incentive, nor was there any prior history of the bonus program through Hyatt. They questioned if the goal was supposed to be set by the travel advisor or by the Privé program.
The TA’s were unfamiliar with the need of these data points, as well as not seeing a use for either of them. They mentioned that they did not see the importance of the goal tracker or leaderboard since there was no visible incentive, nor was there any prior history of the bonus program through Hyatt. They questioned if the goal was supposed to be set by the travel advisor or by the Privé program.
The TA’s were unfamiliar with the need of these data points, as well as not seeing a use for either of them. They mentioned that they did not see the importance of the goal tracker or leaderboard since there was no visible incentive, nor was there any prior history of the bonus program through Hyatt. They questioned if the goal was supposed to be set by the travel advisor or by the Privé program.
Dashboard Data Refresh Frequency
Dashboard Data Refresh Frequency
Dashboard Data Refresh Frequency
The travel agents wanted the dashboard to update daily, specifically the travel advisor that was part of a large agency dealing with large amounts of bookings. Moritz, who deals with a larger agency, mentioned that 2 hours was a long period of time with refreshing client data due to the large volume of bookings.
Some travel agents also mentioned that they would like the ability to compare the dashboard data from year to year to view their progress. They mentioned that they would like at least two years of historical data.
Initial Wireframes
Initial Wireframes
Initial Wireframes
The following wireframes were designed based on the design and feature requirements from the Hyatt Privé team, along with a populated hi-fi design with fake data.
The following wireframes were designed based on the design and feature requirements from the Hyatt Privé team, along with a populated hi-fi design with fake data.
The following wireframes were designed based on the design and feature requirements from the Hyatt Privé team, along with a populated hi-fi design with fake data.


Implementing the Feedback
Implementing the Feedback
Implementing the Feedback
The final design contains the major themes of feedback that was provided by our participants. These changes included a higher priority and focus on the main metric items they wanted to track, as well as tracking their top Hyatt properties where their clients book the most.
The final design contains the major themes of feedback that was provided by our participants. These changes included a higher priority and focus on the main metric items they wanted to track, as well as tracking their top Hyatt properties where their clients book the most.
The final design contains the major themes of feedback that was provided by our participants. These changes included a higher priority and focus on the main metric items they wanted to track, as well as tracking their top Hyatt properties where their clients book the most.


Next Steps
Next Steps
Next Steps
The designs have been handed off to development. The first version of the dashboard is currently being implemented into the Hyatt Privé website.
The designs have been handed off to development. The first version of the dashboard is currently being implemented into the Hyatt Privé website.
The designs have been handed off to development. The first version of the dashboard is currently being implemented into the Hyatt Privé website.
© 2024, SCOTT KEHRES